
How to Access and Interpret Documentation Insights
This guide demonstrates how to navigate to the Insights dashboard, filter data by date range, review key performance metrics for your documentation, and analyze user feedback for specific guides.
Beginner2 minutes7 steps
Overview
Learn to effectively use the Insights dashboard to monitor the performance of your documentation. This includes understanding overall traffic, identifying top-performing content, and diving into detailed analytics and user feedback for individual guides.
When to Use
Use this workflow when you need to understand how your documentation is performing, identify popular or underperforming content, or review user feedback to improve your guides.
Prerequisites
- Access to the documentation platform with appropriate permissions.
- Published guides, collections, or scenarios within your workspace to generate data.
Steps
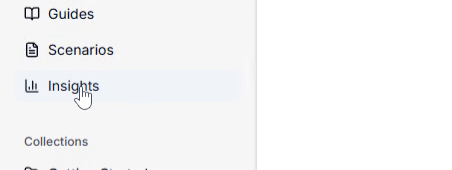
Access the Insights Dashboard
Begin by navigating to the Insights section of your workspace to view a high-level overview of your documentation's performance.
- Click Insights in the left-hand sidebar navigation.
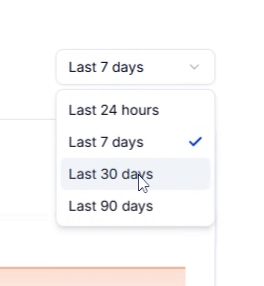
Filter Global Insights by Date Range
The Insights dashboard allows you to filter data by different time periods to analyze trends and performance over your desired duration.
- Click the Last 7 days dropdown button located at the top right of the dashboard.
- Select Last 30 days from the dropdown menu to apply the filter.
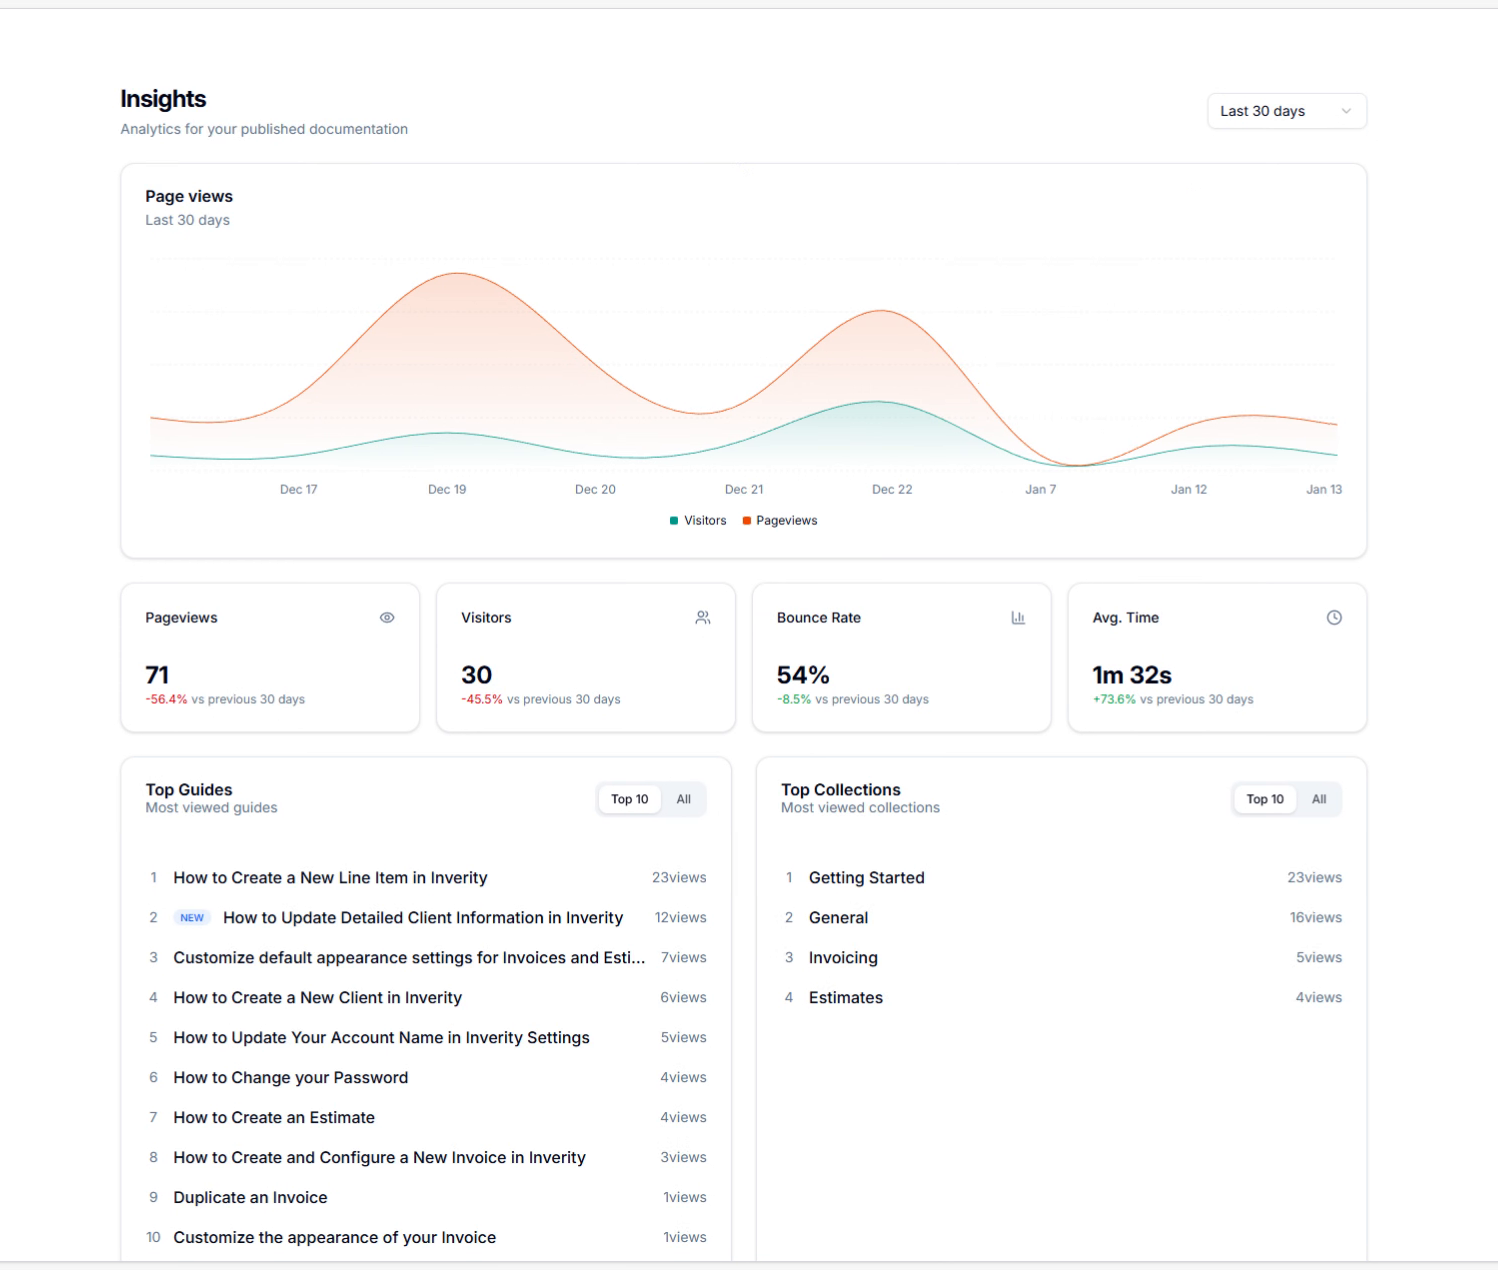
Review Key Performance Metrics and Top Content
The Insights dashboard provides an overview of your documentation's performance, including total pageviews, unique visitors, and lists of your most popular guides and collections. Hover over any listed item to view detailed metrics for that specific piece of content.
- Observe the Pageviews and Visitors charts to identify trends over the selected period.
- Review the Top Guides list for articles with the highest engagement.
- Review the Top Collections list for the most popular content categories.
- Hover over individual guides or collections to see detailed metrics such as Pageviews, Visitors, Bounce Rate, and Avg. Time.
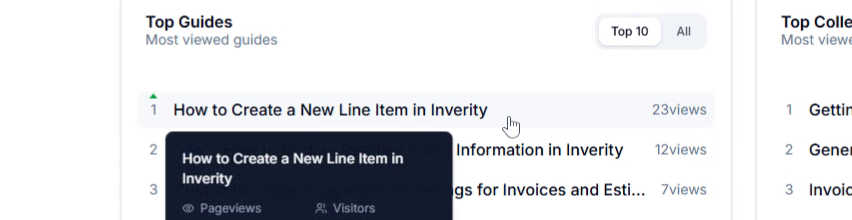
View Insights for a Specific Guide
To analyze the performance of a particular guide in more detail, navigate to its dedicated insights page.
- Click on a guide title, for example, How to Create a New Line Item in Inverity, from the Top Guides section.
Adjust Date Range for Individual Guide Insights
On a specific guide's insights page, you can also adjust the date range to focus on its performance during different periods.
- Click the Last 7 days dropdown button.
- Select Last 30 days from the options.
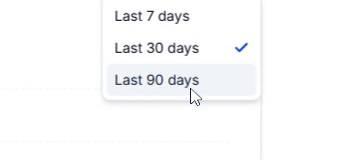
- Click the Last 30 days dropdown button again.
- Select Last 90 days from the new options to view the guide's performance over a longer period.
Review User Feedback for the Guide
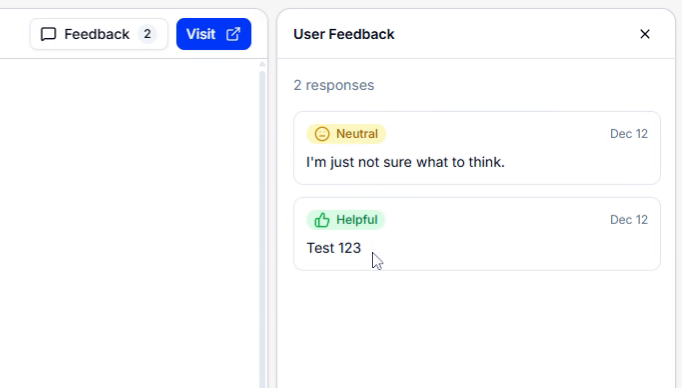
Access the feedback panel to review comments and ratings submitted by users for the specific guide, providing valuable qualitative insights.
- Click the Feedback button (e.g., displaying "75% helpful") on the guide's insights page to open the feedback panel.
- Review individual feedback responses within the panel.
- Click on a specific feedback comment, such as "I'm just not sure what to think.", to focus on its content.
- Click on another feedback comment, such as "Test 123".
Close the Feedback Panel
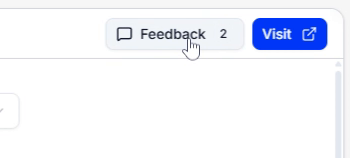
After reviewing user feedback, you can close the feedback panel to return to the guide's analytics overview.
- Click the Feedback button in the header again to close the feedback panel.
Troubleshooting
Insights data is not updating after changing the date range.
Ensure your documentation has been published and has received recent activity within the selected date range. Data may also take a few minutes to refresh. If the issue persists, contact support.
Cannot find a specific guide or collection in the insights list.
Verify that the guide or collection exists and is published. Use the search or filter options in the main 'Insights' dashboard to locate it if it's not in the top results.
The feedback panel is empty or shows no recent comments.
Confirm that users have submitted feedback for the specific guide. If feedback mechanisms are new, it may take time for responses to accumulate. Also, check if feedback collection is enabled for your guides.